

Digital marketing moves fast. Blink and you might miss the latest trend or algorithm change. For B2B companies, keeping pace can feel like running on a treadmill that keeps speeding up. You're hustling, but are you actually getting anywhere?
That's where benchmarks come in. They give you a reality check. A way to see if all that effort is paying off or if you're just spinning your wheels. But good luck finding reliable B2B-specific benchmarks. Most reports lump B2B and B2C together, glossing over the nuances of long sales cycles and complex buying committees.
I've seen firsthand how hard it is for companies to know if they're on the right track. So I decided to do something about it. We dug into the data from hundreds of B2B clients across industries to surface meaningful benchmarks. Consider this your field guide to the current B2B digital marketing landscape.
Website Traffic: Quality Over Quantity
| Company Size | Monthly Visitors | Avg. Conversion Rate |
|---|---|---|
| Small (<$10M) | 1,000 - 3,000 | 2.0% - 3.0% |
| Mid-sized ($10M - $100M) | 5,000 - 15,000 | 1.5% - 2.5% |
| Enterprise ($100M+) | 50,000+ | 1.0% - 2.0% |
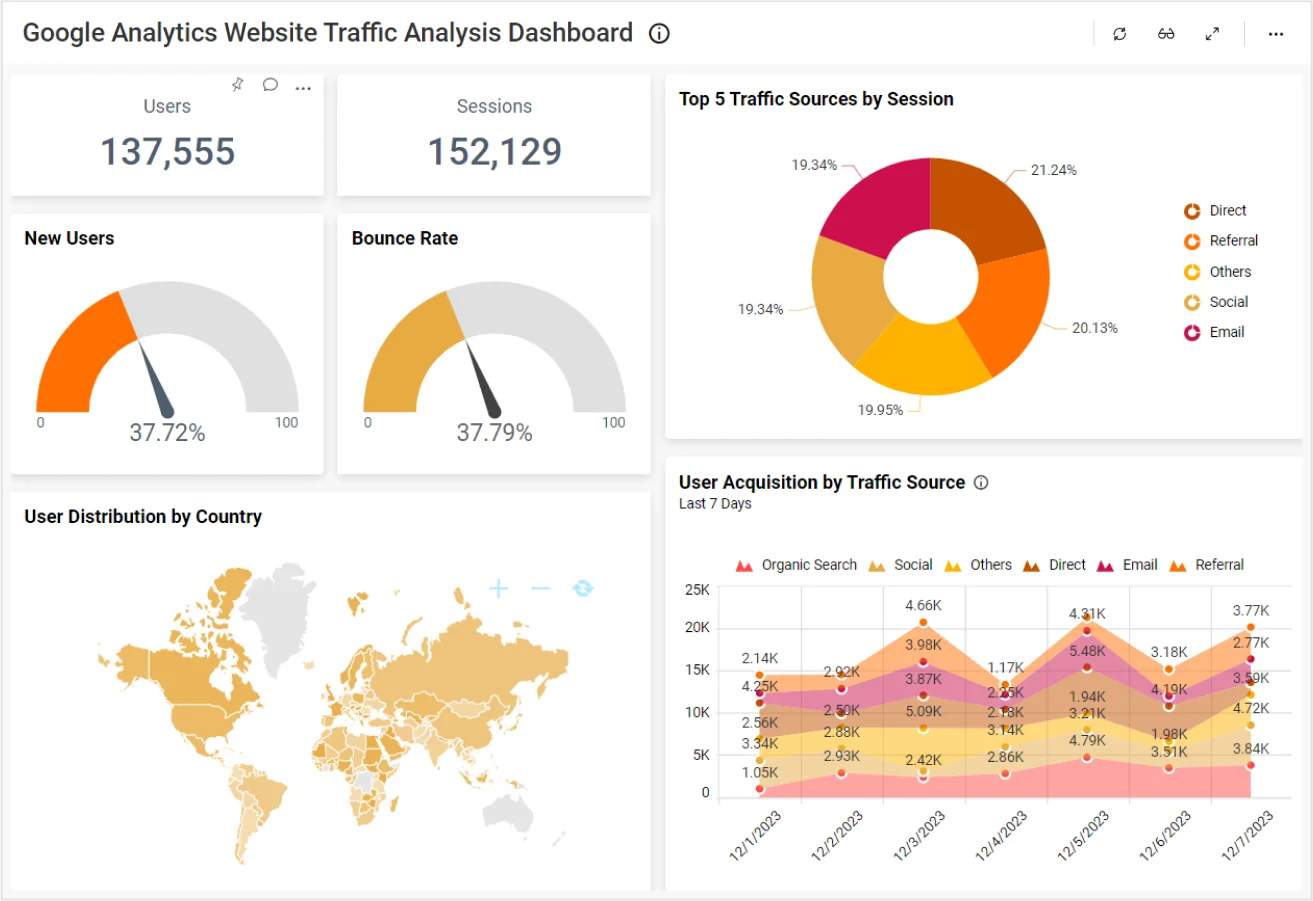
Let's start with the basics: website traffic. It's tempting to obsess over raw visitor numbers. More is always better, right? Not so fast. For B2B companies, quality trumps quantity every time.

Our data shows that top-performing B2B websites convert about 2.5% of visitors into leads. Anything above 3% puts you in rarefied air. But here's the kicker - companies hitting those numbers often have lower overall traffic. They're laser-focused on attracting the right visitors, not just any visitors. This is the foundation of B2B lead generation, where the goal isn’t just to drive clicks but to convert those visitors into high-value prospects through targeted landing pages and optimized user journeys.
Take one of our software clients. They slashed their paid search budget by 40%, cutting out broad match keywords. Traffic dipped, but conversion rates doubled. They ended up with more qualified leads despite fewer visitors. Sometimes you have to go slow to go fast.
That said, you do need a baseline of traffic to work with. Our benchmarks show:
- Small B2B companies (<$10M revenue): 1,000 - 3,000 monthly visitors
- Mid-sized ($10M - $100M): 5,000 - 15,000 monthly visitors
- Enterprise ($100M+): 50,000+ monthly visitors
But remember, these are just averages. A niche industrial manufacturer might thrive with 500 highly qualified visitors. A broad-based SaaS company might need 100,000+ to move the needle. Context matters.

Content Marketing: The Long Game
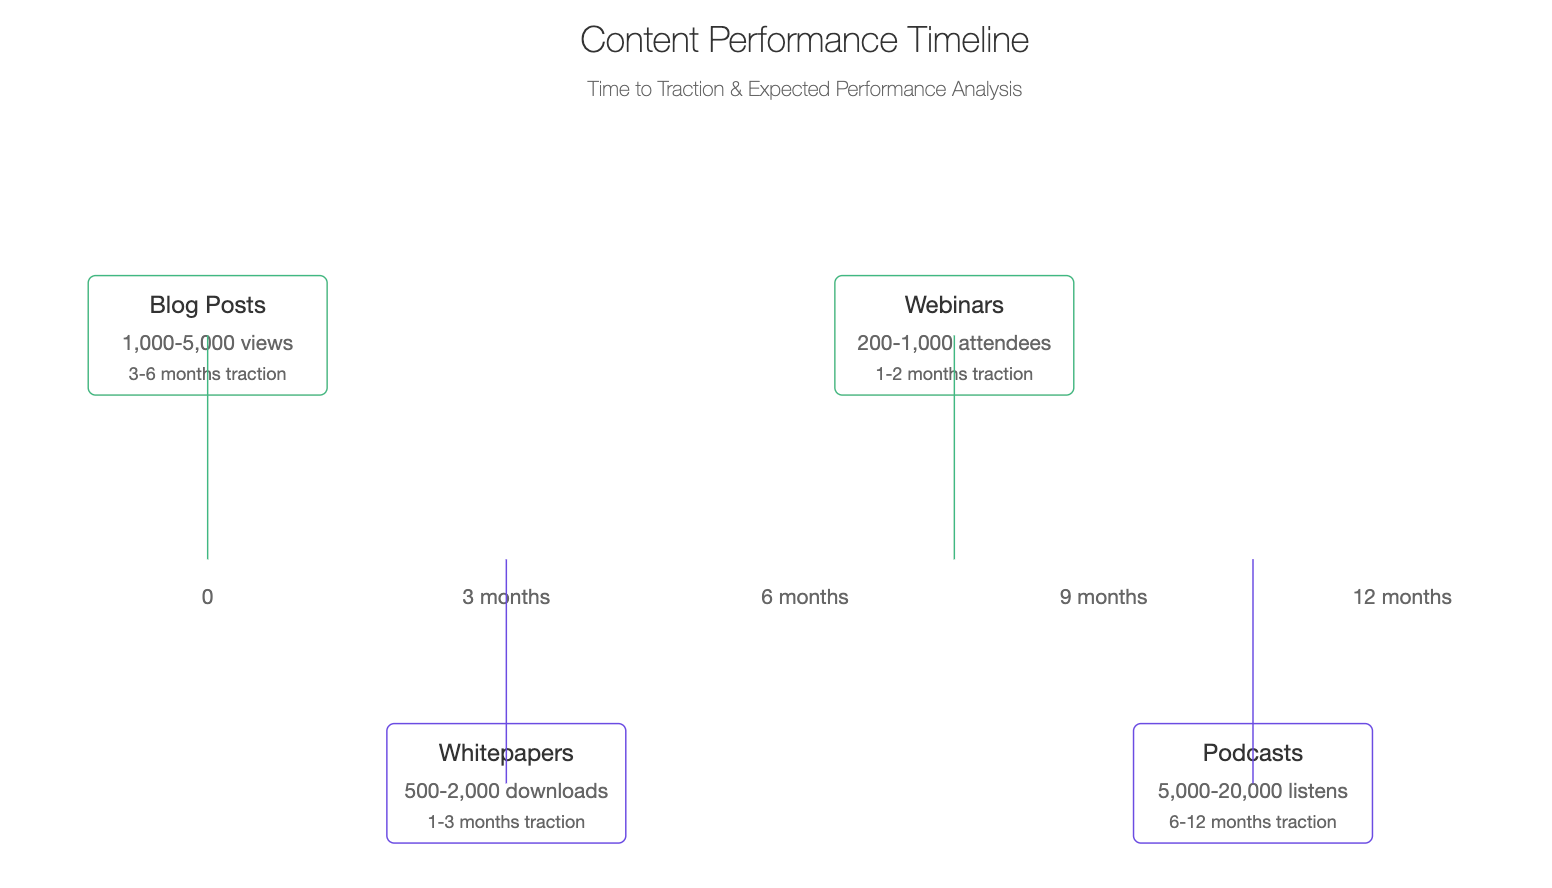
| Content Type | Avg. Time to Traction | Expected Monthly Views (After 6 months) |
|---|---|---|
| Blog Posts | 3-6 months | 1,000 - 5,000 |
| Whitepapers | 1-3 months | 500 - 2,000 downloads |
| Webinars | 1-2 months | 200 - 1,000 attendees |
| Podcasts | 6-12 months | 5,000 - 20,000 listens |
Content is the engine that drives B2B digital marketing. It builds trust, showcases expertise, and nurtures leads through long sales cycles. But it's a marathon, not a sprint. Our data shows it takes 6-12 months of consistent publishing before most B2B companies see significant traction.
Consistency is key. We found companies that publish at least weekly see 2x the traffic growth compared to those publishing monthly or less. But quality still matters. One standout blog post can outperform dozens of mediocre ones.
Here are some content benchmarks to aim for:
- Blog traffic: 1,000 - 5,000 monthly visitors per post (after 6 months)
- Email newsletter: 20-30% open rate, 2-5% click-through rate
- Gated content: 25-50% conversion rate on landing pages
Again, these vary widely by industry and content type. A groundbreaking industry report might see 70%+ conversion rates. A general "tips" blog post might only get a few hundred views. The key is to track your own trends over time.
One often overlooked metric: content longevity. We found that top-performing B2B blog posts continue to drive significant traffic 2-3 years after publication. They become evergreen assets. If your content has a shelf life of weeks, not years, it's time to rethink your strategy.

Social Media: It's Complicated
| Platform | Avg. Engagement Rate | % of B2B Traffic/Leads |
|---|---|---|
| 0.5% - 1.5% | 60% - 80% | |
| 0.2% - 0.8% | 10% - 20% | |
| 0.1% - 0.5% | 5% - 15% | |
| 0.8% - 2.0% | 1% - 5% |
Social media for B2B is... tricky. It's easy to get caught up in vanity metrics like followers or likes. But those rarely translate to bottom-line impact. Our data shows that for most B2B companies, social media drives less than 5% of website traffic and leads.
That doesn't mean ignore it. Social can be a powerful tool for brand building, recruiting, and staying top-of-mind with prospects. But it requires a different approach than B2C. Here's what we've found works:
- LinkedIn is king. It drives 80%+ of social traffic and leads for most B2B companies.
- Twitter is hit-or-miss. Great for tech and media companies, less impactful for others.
- Facebook and Instagram rarely move the needle (with some exceptions).
Engagement rates tell the real story. Here are some LinkedIn benchmarks:
| Post Type | Avg. Engagement Rate |
|---|---|
| Text | 0.1% - 0.3% |
| Image | 0.3% - 0.5% |
| Video | 0.5% - 1.0% |
| Poll | 1.0% - 3.0% |
Engagement rate = (likes + comments + shares) / impressions
These might seem low, but remember - B2B audiences are smaller and more focused. A 0.5% engagement rate on a niche industrial post could be excellent if it's reaching the right people.
The companies seeing the most social success treat it as a two-way street. They're not just broadcasting. They're listening, responding, and building genuine connections. It's slow-burn community building, not viral marketing.

Email Marketing: Old Dog, New Tricks
| Email Type | Avg. Open Rate | Avg. Click-Through Rate |
|---|---|---|
| Welcome Series | 50% - 60% | 20% - 30% |
| Newsletters | 15% - 25% | 2% - 5% |
| Promotional | 10% - 20% | 1% - 3% |
| Re-engagement | 5% - 15% | 0.5% - 2% |
Email might not be sexy, but it's still the workhorse of B2B marketing. Our data shows it drives 2-3x more conversions than any other channel for most B2B companies. But inbox competition is fierce. Generic blasts don't cut it anymore.
Here are some email benchmarks to track:
- Open rate: 15-25% (industry average)
- Click-through rate: 2-5%
- Unsubscribe rate: <0.5% per email
Top performers are hitting 30%+ open rates and 10%+ click-through rates. How? Personalization and segmentation. We found that segmented campaigns see 3-5x higher engagement than one-size-fits-all approaches.
One client in the HR tech space saw a 200% jump in demo requests by creating separate nurture tracks for different buyer personas. They tailored content to specific pain points and use cases. It took more work upfront, but the results were undeniable.
Another key trend: interactive emails. Embedded surveys, polls, and calculators are driving significantly higher engagement. They turn passive readers into active participants. One manufacturing client saw a 4x increase in click-through rates by adding a simple ROI calculator to their nurture emails.
The best B2B email marketers think beyond the inbox. They're integrating email with other channels, using it to drive webinar signups, content downloads, and social engagement. It's not just about opens and clicks. It's about moving prospects through the funnel.

Paid Search: A Necessary Evil?
| Industry | Avg. CPC | Avg. Conversion Rate | Avg. Cost Per Lead |
|---|---|---|---|
| B2B Tech | $3.80 | 2.55% | $208 |
| Industrial Services | $2.56 | 2.58% | $132 |
| Financial Services | $3.44 | 2.93% | $160 |
| Healthcare | $2.62 | 2.80% | $124 |
| Marketing Services | $3.33 | 3.04% | $141 |
Love it or hate it, paid search is a fact of life for most B2B marketers. It's a reliable way to get in front of active buyers. But it's also expensive and getting more so. Our data shows B2B cost-per-click (CPC) rates have increased 15-20% year-over-year across most industries.
Here are some benchmarks to keep in mind:
- Average CPC: $2 - $4 (B2B services), $3 - $6 (B2B software)
- Conversion rate: 2.5% - 5% (form fills / demo requests)
- Cost per lead: $50 - $200 (varies widely by industry)
The companies seeing the best ROI are hyper-focused on intent. They're bidding on long-tail keywords that signal buying intent, not broad industry terms. They're using ad extensions and sitelinks to pre-qualify clicks. And they're obsessive about post-click experiences, with dedicated landing pages for each ad group.
One often overlooked metric: assisted conversions. We found that paid search influences 2-3x more conversions than it gets direct credit for. People click ads, browse, then come back later through organic or direct traffic. Make sure your attribution model captures this.
It's also worth experimenting with different ad networks. While Google still dominates, we're seeing strong results from Bing for certain B2B verticals. LinkedIn ads can be pricey, but work well for targeting specific job titles or companies. The key is to test and iterate constantly.
The Metrics That Really Matter
| Metric | Definition | Benchmark |
|---|---|---|
| MQL to SQL Conversion | % of MQLs that become SQLs | 20% - 30% |
| SQL to Opportunity Conversion | % of SQLs that become sales opportunities | 20% - 40% |
| Opportunity to Customer Conversion | % of opportunities that become customers | 20% - 30% |
| Customer Acquisition Cost (CAC) | Total sales & marketing spend / New customers acquired | Varies by industry |
| Customer Lifetime Value (CLV) | Avg. revenue per customer * Avg. customer lifespan | Should be 3x+ CAC |
We've covered a lot of ground, but here's the thing: all these benchmarks are just guideposts. The metrics that really matter are unique to your business. They tie directly to revenue and growth goals.
For most B2B companies, we recommend focusing on these core KPIs:
- Marketing Qualified Leads (MQLs)
- Sales Qualified Leads (SQLs)
- Customer Acquisition Cost (CAC)
- Customer Lifetime Value (CLV)
- Time to Conversion
Everything else - traffic, engagement, click-throughs - are just leading indicators. They matter, but only insofar as they drive these core metrics.
The best B2B marketers obsess over the full funnel. They know exactly how many MQLs they need to hit revenue targets. They understand their lead-to-customer conversion rates at each stage. And they're constantly refining their processes to improve those numbers.
So, How Do You Measure Up?
Take a hard look at your own metrics. How do they compare to these benchmarks? Where are you excelling? Where are you falling short?
But don't just fixate on the numbers. Dig into the why behind them. Are you attracting the right audience? Is your messaging resonating? Are you delivering real value at every touchpoint?
Remember, these benchmarks are averages. The goal isn't to be average. It's to be exceptional in the ways that matter most to your business. Maybe that means sacrificing traffic for higher quality leads. Maybe it means investing heavily in content even when the ROI isn't immediately clear.
The B2B companies winning at digital marketing aren't just chasing metrics. They're building relationships. They're solving real problems. They're playing the long game.
So by all means, use these benchmarks as a starting point. But don't let them constrain you. The most successful B2B marketers are the ones writing their own rules.
What unconventional strategies are moving the needle for your business? I'd love to hear about it. Drop a comment or reach out directly. Let's push this conversation forward.
FAQ
Q1: How often should I benchmark my B2B digital marketing performance?
A: Benchmark quarterly. This frequency allows you to spot trends without getting bogged down in short-term fluctuations. Annual reviews are too infrequent in the fast-paced digital landscape.
Q2: Are industry-wide benchmarks really relevant for my specific business?
A: They're a starting point, not an end goal. Use them to gauge your general position, but focus more on improving your own metrics over time. Your business is unique, and your benchmarks should reflect that.
Q3: What's the most important B2B digital marketing metric to track?
A: Customer Acquisition Cost (CAC) in relation to Customer Lifetime Value (CLV). This ratio indicates the sustainability and efficiency of your marketing efforts. Aim for a CLV at least 3x your CAC.
Q4: How can I improve my website's conversion rate?
A: Focus on relevance and clarity. Create industry-specific landing pages, use clear calls-to-action, and ensure your value proposition is immediately obvious. A/B test consistently to find what resonates with your audience.
Q5: Is social media really worth the effort for B2B companies?
A: Yes, but be strategic. LinkedIn is typically the most effective platform for B2B. Focus on sharing valuable insights and building relationships rather than direct promotion. Quality trumps quantity in B2B social media.
Q6: How long does it take to see results from content marketing?
A: Expect a 6-12 month ramp-up period. Consistency is key. You're building authority and trust, which takes time. However, you should see gradual improvements in traffic and engagement within the first few months.
Q7: What's a good email open rate for B2B marketing?
A: Aim for 20-25%. However, focus more on click-through and conversion rates. A lower open rate with higher engagement can be more valuable than a high open rate with low click-throughs.
Q8: How can I reduce my customer acquisition costs?
A: Optimize your funnel, not just your top-of-funnel activities. Improve lead scoring to focus on quality over quantity. Invest in customer retention and upselling to existing clients, which is typically more cost-effective than acquiring new ones.
Q9: What's the ideal frequency for posting on the company blog?
A: Quality over quantity. For most B2B companies, 1-2 high-quality, in-depth posts per week is more effective than daily shorter posts. Consistency matters more than frequency.
Q10: How do I know if my paid search campaigns are performing well?
A: Look beyond click-through rates. Focus on conversion rates and cost per acquisition. A good B2B campaign should have a conversion rate of 2-5% for form fills or demo requests. Your cost per acquisition should be significantly lower than your customer lifetime value.